Terms and conditions
Entry in this contest constitutes your acceptance of these terms and conditions.
Please read these Terms and Conditions (“Terms”) carefully as they form a binding legal agreement between you and Data Visualization Software Lab Ltd, a Latvian corporation with principal place of business at 8B Gunara Astras Street, Riga, Latvia ("DVSL" or “Organiser”) with respect to the Contest.
The Terms include information about how we use your personal information when you register for the Contest (as defined below) or participate in the Contest. UNLESS YOU AGREE TO THE TERMS, YOU (1) MUST NOT REGISTER FOR OR PARTICIPATE IN THE CONTEST AND (2) ARE NOT ELIGIBLE TO RECEIVE PRIZES UNDER THE CONTEST.
CONTEST IS INTENDED FOR THE RESIDENTS AND/OR CITIZENS OF ARMENIA, ALBANIA, AZERBAIJAN, BELARUS, BOSNIA & HERCEGOVINA, BULGARIA, CROATIA, ESTONIA, GEORGIA, KAZAKHSTAN, KYRGYZSTAN, LATVIA, LITHUANIA, KOSOVO, SERBIA, MOLDOVA, N. MACEDONIA, MONGOLIA, MONTENEGRO, SLOVENIA, TAJIKISTAN, TURKMENISTAN, UKRAINE, UZBEKISTAN.
-
OVERVIEW
-
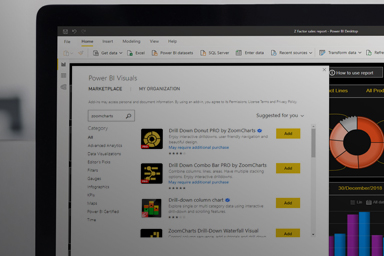
The Power BI Zoom Factor Report Contest (the “Contest”) is a skill-based contest where participants must develop a report using Microsoft Power BI and ZoomCharts Drill Down Visuals data visualization tool within Power BI that leverages the capabilities of Microsoft Power BI and
-
OVERVIEW 2
-
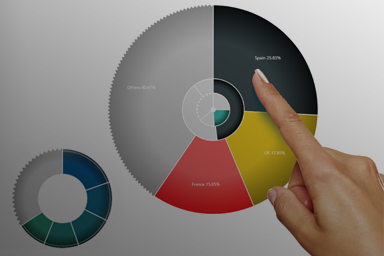
The Power BI Zoom Factor Report Contest (the “Contest”) is a skill-based contest where participants must develop a report using Microsoft Power BI and ZoomCharts Drill Down Visuals data visualization tool within Power BI that leverages the capabilities of Microsoft Power BI and
-
OVERVIEW 3
-
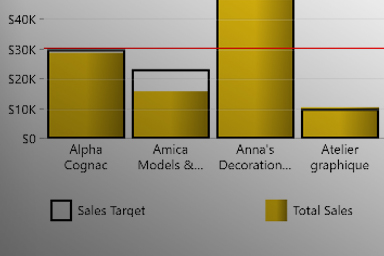
The Power BI Zoom Factor Report Contest (the “Contest”) is a skill-based contest where participants must develop a report using Microsoft Power BI and ZoomCharts Drill Down Visuals data visualization tool within Power BI that leverages the capabilities of Microsoft Power BI and
-
OVERVIEW 4
-
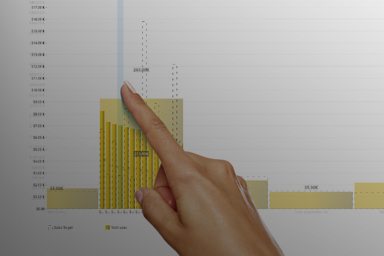
The Power BI Zoom Factor Report Contest (the “Contest”) is a skill-based contest where participants must develop a report using Microsoft Power BI and ZoomCharts Drill Down Visuals data visualization tool within Power BI that leverages the capabilities of Microsoft Power BI and
-
OVERVIEW 5
-
The Power BI Zoom Factor Report Contest (the “Contest”) is a skill-based contest where participants must develop a report using Microsoft Power BI and ZoomCharts Drill Down Visuals data visualization tool within Power BI that leverages the capabilities of Microsoft Power BI and